
On this page we depict the radial (vertical downward) component of various magnetic field models, evaluated at Earth’s surface. These are predictions of the magnetic field from different physical sources individually, so that the total magnetic field is a sum of these components. Each model is shown over different time scales, appropriate to the nature of each source. The models themselves are derived empirically from measurements of the magnetic field made both on Earth and in space.
- Earth’s Core (the “main field”)
- Lithosphere
- Ionosphere: Mid latitudes
- Ionosphere: High latitudes
- Magnetosphere
- and more…
Earth’s Core (the “main field”)
The main magnetic field originates from electric currents within Earth’s outer core, which is composed mostly of liquid iron. A complex interaction of fluid motion and magnetohydrodynamics produces a self-sustaining magnetic field through a process we refer to as the geodynamo. The shape of the field is predominantly dipolar, aligned North-South, so that compasses point approximatly Northward, but the particular direction (magnetic declination) changes between locations and over time. The dynamic nature of the source also occasionally causes reversals of the poles.
The radial component of the main magnetic field over the past century (IGRF-13). Note that the magnitude of this field is ~1000x that of the following fields.
Looking at the field in this way reveals only subtle changes - though this only shows a short time period, geologically speaking. However, there is an obvious change over the South Atlantic and South America (but remember this is only the radial component of the vector - the total intensity is not dropping to zero). It is more instructive to look at the other vector components together - see the Core field gallery. This regional weakening of the field has impacts on spacecraft due to a higher incidence of incoming radiation from space, and is connected with a global weakening (read more).
See also: https://maps.ngdc.noaa.gov/viewers/historical_declination/
Lithosphere
The lithosphere, or crust (in geomagnetism we tend not to make the distinction between the two), is the rocky outer layer of the planet. The crust is composed of many different minerals and structures which have different magnetic properties, though can broadly be described as having both induced and remanent magnetizations (that which is induced by the main field, and that which would persist in the absence of the main field having been created during the formation of the rock). The integrated effect of the crustal magnetization is a magnetic field with a lot of fine structure. To get the full picture of this field, we use the globally distributed measurements from spacecraft together with regional and local surveys using aircraft and ships. While space measurements can give us a global model of the lithospheric field such as that shown below, many regional surveys must be compiled together to show it at higher resolution (e.g. WDMAM) - this is because the shorter wavelength components dissolve away once we reach satellite altitude.
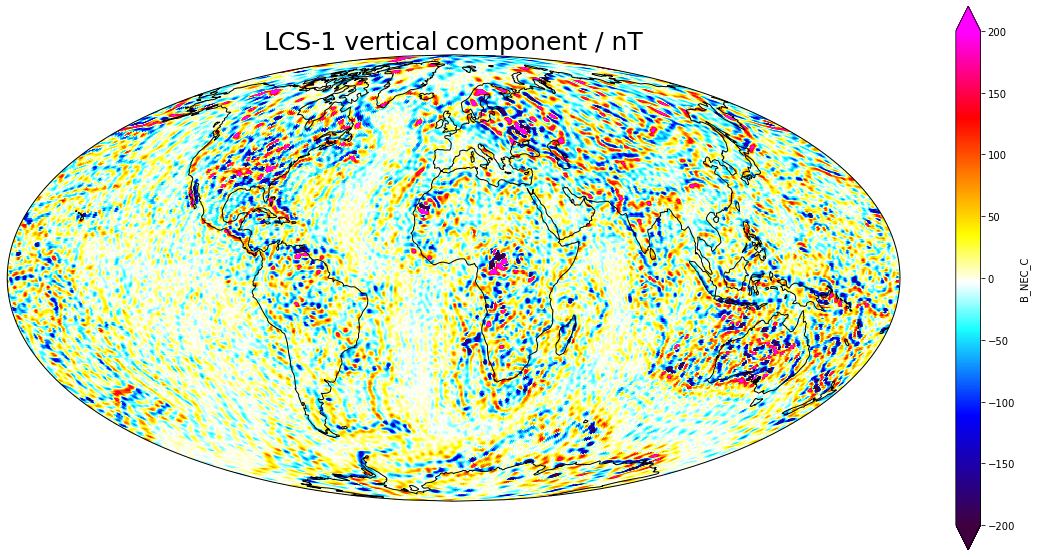
The radial component of the large scale wavelengths (>~100km) of the lithospheric field (LCS-1)
Ionosphere: Mid latitudes
Due to the action of ionising sunlight and the low particle density, the upper atmosphere is partially ionised above about 50km altitude and is referred to as the ionosphere, stretching out to about 1000km altitude. This means there are unbound electrons and ions (charged particles) which can carry electric currents. Sunlight heats the dayside of the ionosphere causing thermal expansion over the illuminated hemisphere, which causes a large scale flow (wind) due to the pressure gradient created. This flow pushes the charged particles through Earth’s main field, leading to a dynamo interaction and ensuing magnetic field pattern centred on the subsolar point (the point on Earth’s surface directly below the Sun).
| Daily variation | Annual variation |
|---|---|
The radial component of the ionospheric field (extracted from the Swarm CI model)
Here we show the variation over two different periods. The daily variation animation shows that each day the ionospheric magnetic field feature sweeps around the Earth as the Earth rotates beneath the sunlight. The feature is divided into two oppositely oriented cells which are aligned along the contours of the main field. The annual variation animation shows a snapshot of the field each day at UTC noon so that we can see how the magnetic field varies between seasons. Over the year the peak intensity shifts between the northern and southern hemisphere as the peak in sunlight (summer) shifts between the hemispheres.
Ionosphere: High latitudes
At high latitudes there is a different story. The shape of the main magnetic field means that the field lines point inwards/outwards at the poles, along which charged particles (ultimately sourced from the solar wind) are channeled, giving rise to the aurorae (the northern and southern lights) and a system of electric currents which are coupled to the magnetosphere. These electric currents are driven by changes in solar activity and are a significant way in which conditions on Earth are affected by space weather.
[TODO: animation consistent with this page]
See also: https://birkeland.uib.no/data/amps/
Magnetosphere
The magnetosphere is the area in space around Earth which is affected by Earth’s main magnetic field. It is populated by energised electrons and protons (plasma) which orbit electromagnetically around Earth in the Van Allen radiation belts, and its boundary is delineated by the magnetopause where the magnetosphere meets the solar wind (itself a flow of plasma from the Sun). The motion of this plasma is in constant change as it interacts with the solar wind, and creates magnetic fields which can be felt at Earth.
The radial component of the magnetospheric field (extracted from the Swarm CI model)
and more…
There are still more global magnetic field sources which we are able to detect, including electric currents induced in the mantle and even in the oceans.